Data fetching and visualization
Medium
·
40 minutes
Prompt
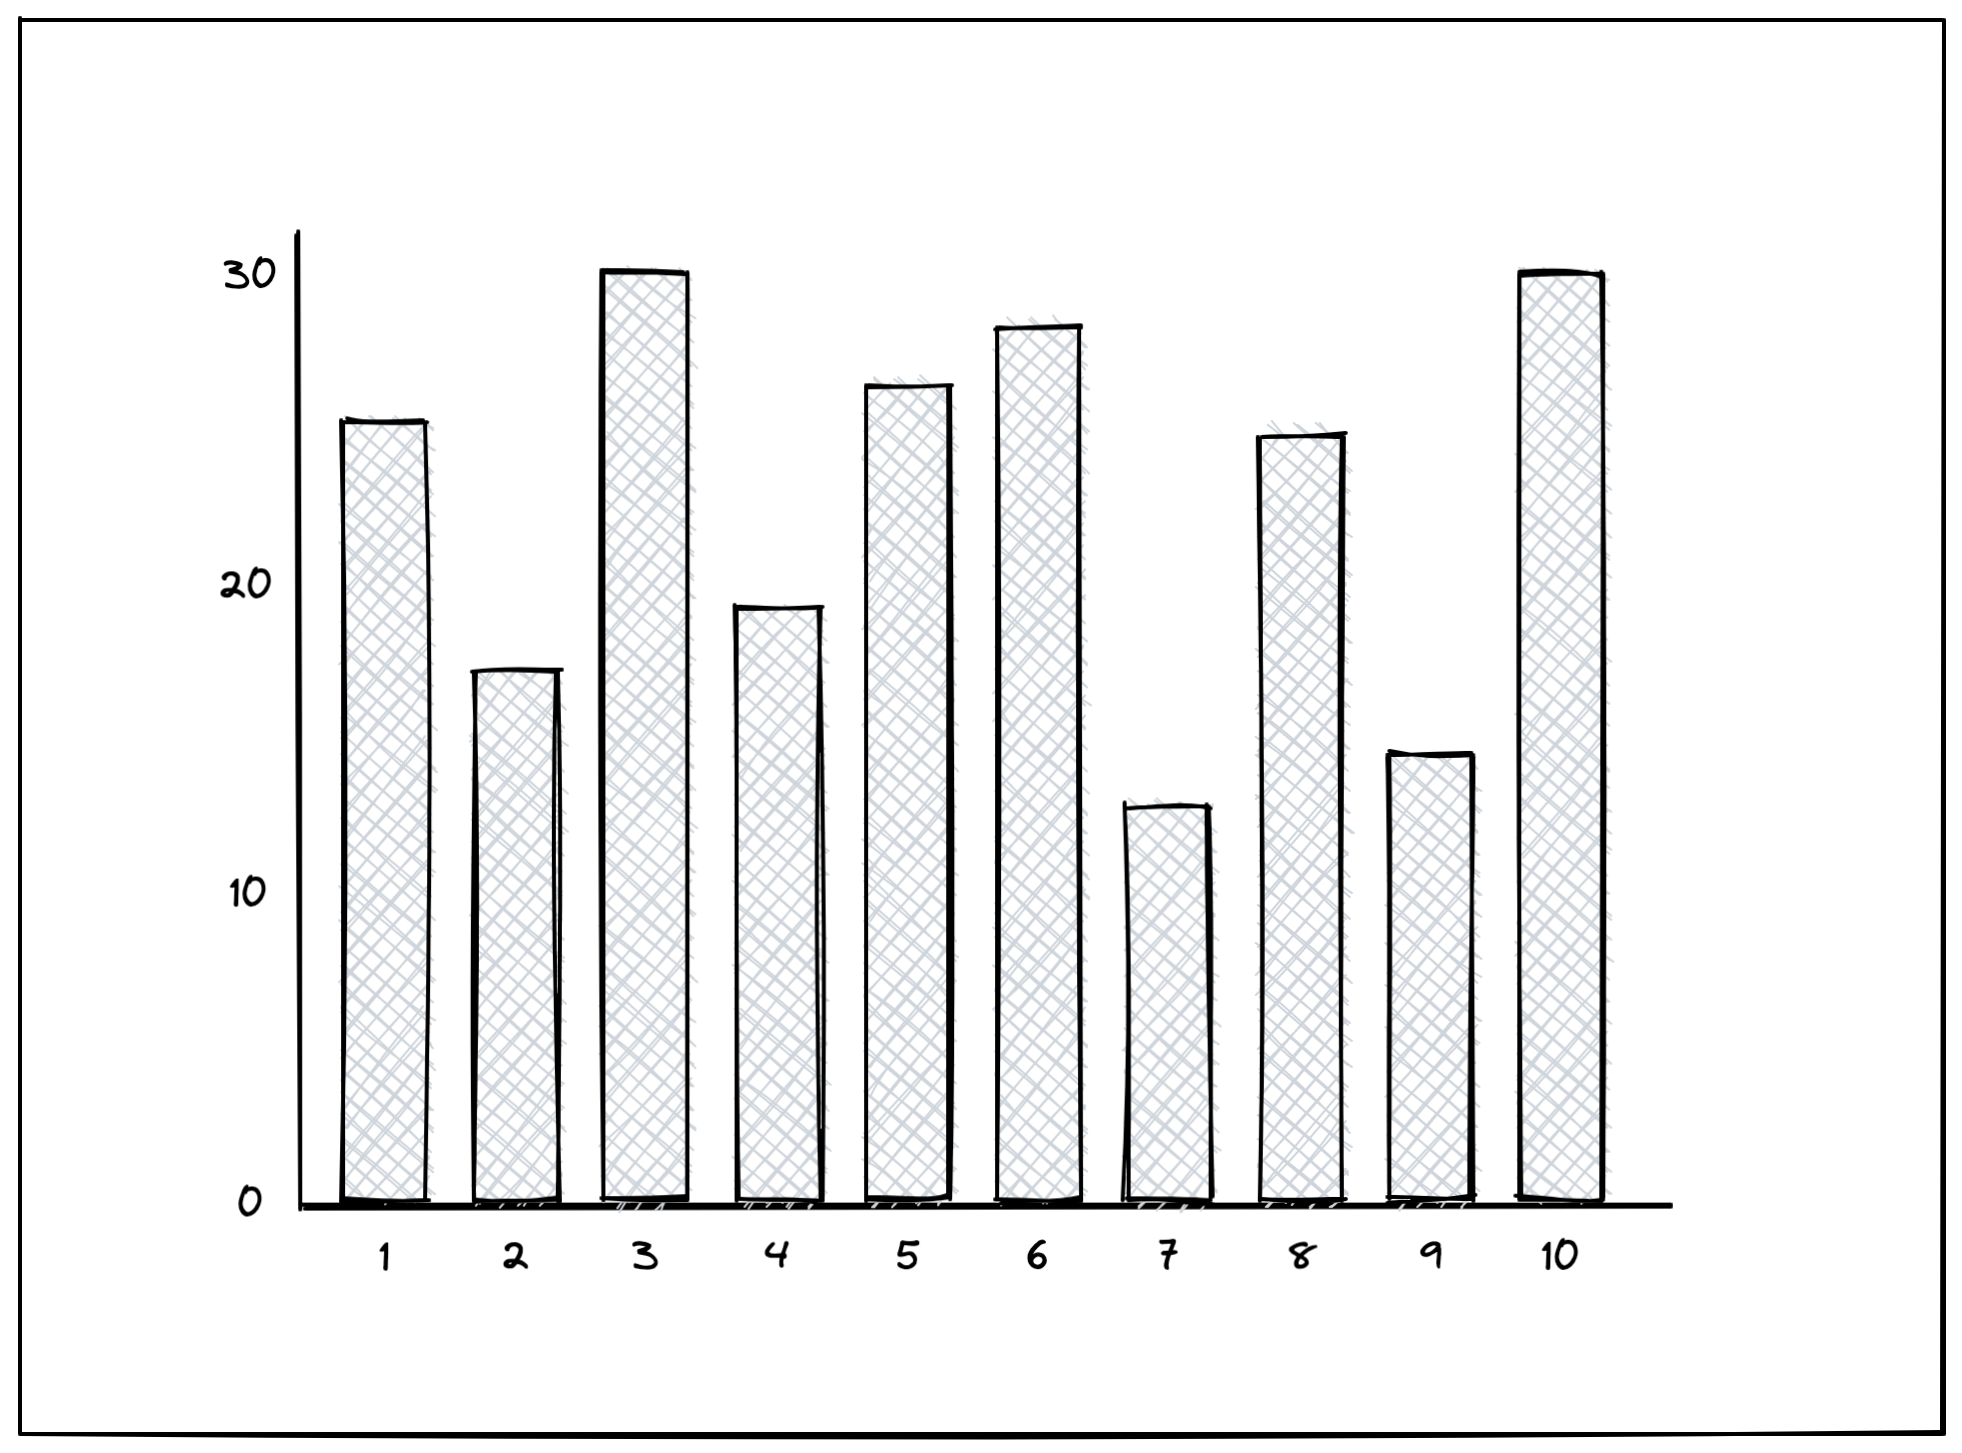
Retrieve a list of numbers from an endpoint, then plot a histogram showing the frequency of each number in the list. The histogram should have appropriately-numbered x and y axes.
In the example below, the list contained 24 ones, 17 twos, 30 threes, and so on.
To get started, fork one of the following Codepen templates: